VaultData · by VisiVault
Turn data into better decisions
VaultData helps organizations transform complex data into clear insights, intelligent dashboards, and better business decisions. It's the original analytics practice behind VisiVault, now operating as one division within a broader technology ecosystem.
Data sources
0 connected
Refresh
Automated
Data Visualization
Dashboards that turn dense data into decisions at a glance.
We design custom dashboards and reports that surface the metrics that actually move your business — built for the people who use them, not just the data behind them.
- Executive and operational dashboards
- Interactive reporting for non-technical teams
- Automated, always-current data refreshes
Predictive Analytics
Forecast demand, risk, and revenue before they happen.
Using statistical models and machine learning, we help you anticipate what's next — from demand and churn to revenue and risk — so decisions are proactive, not reactive.
- Demand and revenue forecasting
- Risk and anomaly detection models
- Ongoing model monitoring and tuning
Data Strategy Consulting
A data strategy built around how your team actually works.
Whether you're formalizing a first data strategy or fixing a broken one, our consultants work alongside your team to set priorities, close gaps, and implement changes that stick.
- Data strategy and roadmap design
- Process and workflow audits
- Tool and vendor selection guidance
Data Integration
One accurate, unified view — no more spreadsheet silos.
We connect the systems your business already runs on — POS, CRM, booking, finance — into a single reliable source of truth, so every team is working from the same numbers.
- Multi-source ETL/ELT pipelines
- Data cleaning and validation
- Warehouse and API integrations
Business Intelligence
Raw data, structured into decisions.
We build the BI layer that connects your data to your strategy — defining the right KPIs, surfacing hidden patterns, and giving leadership a clear view of performance.
- KPI framework design
- Self-serve BI tooling setup
- Trend and pattern analysis
Staff Training
Teams that can read, question, and act on their own data.
Dashboards only pay off when people use them well. We run tailored training so your team is confident working in your analytics platforms day to day, not just on launch day.
- Hands-on platform training
- Custom playbooks and documentation
- Ongoing office hours and support
Case study
A real VaultData project, built end to end
Not a mockup — a working application, deployed and open source, showing how we approach analytics for an SME.
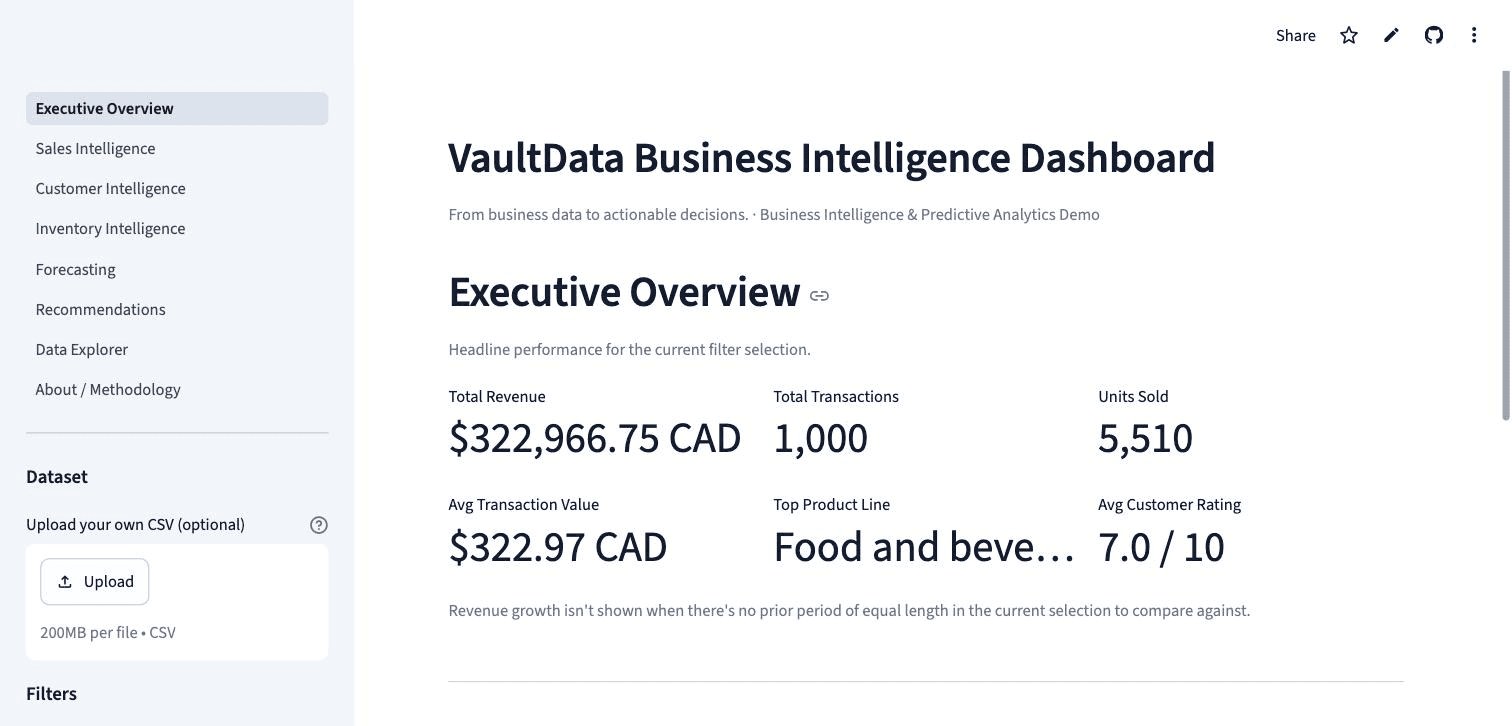
VaultData Business Intelligence Dashboard
From business data to actionable decisions.
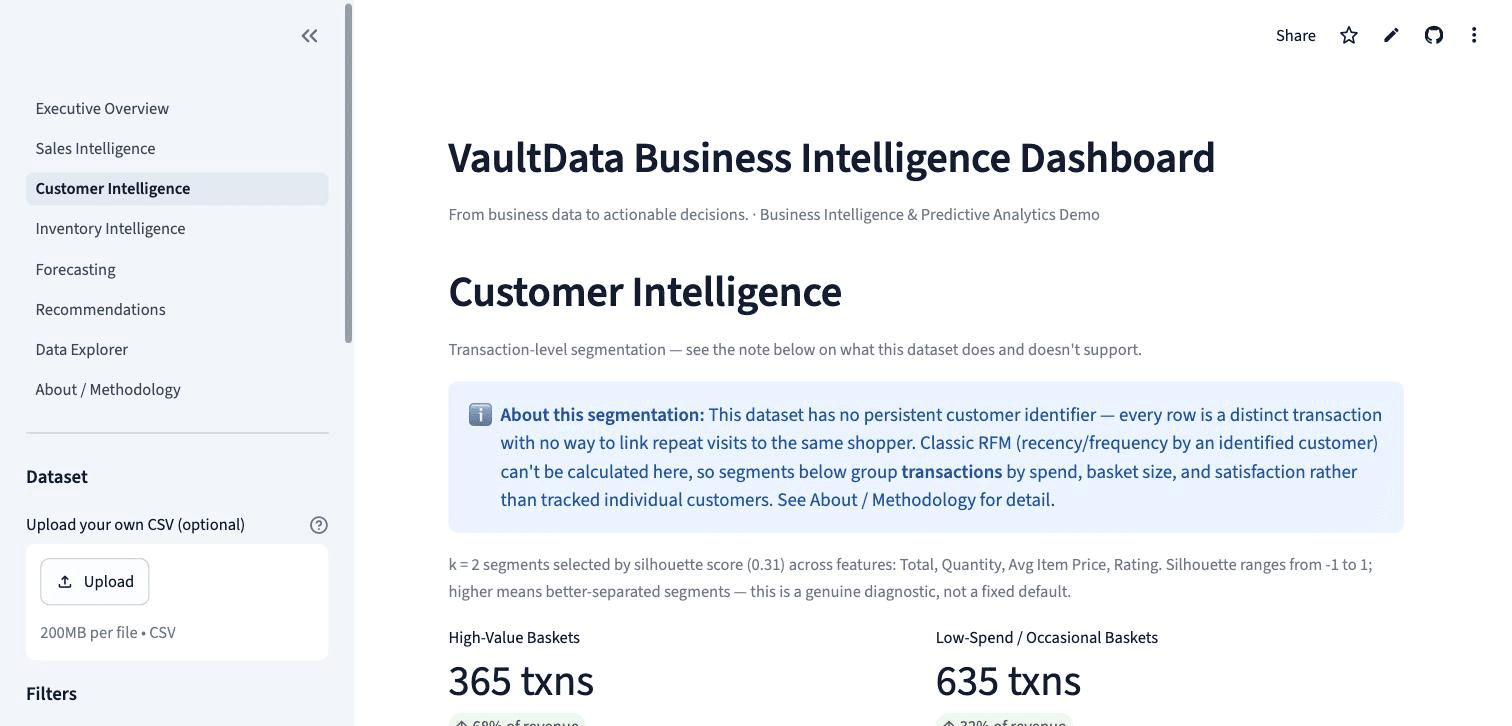
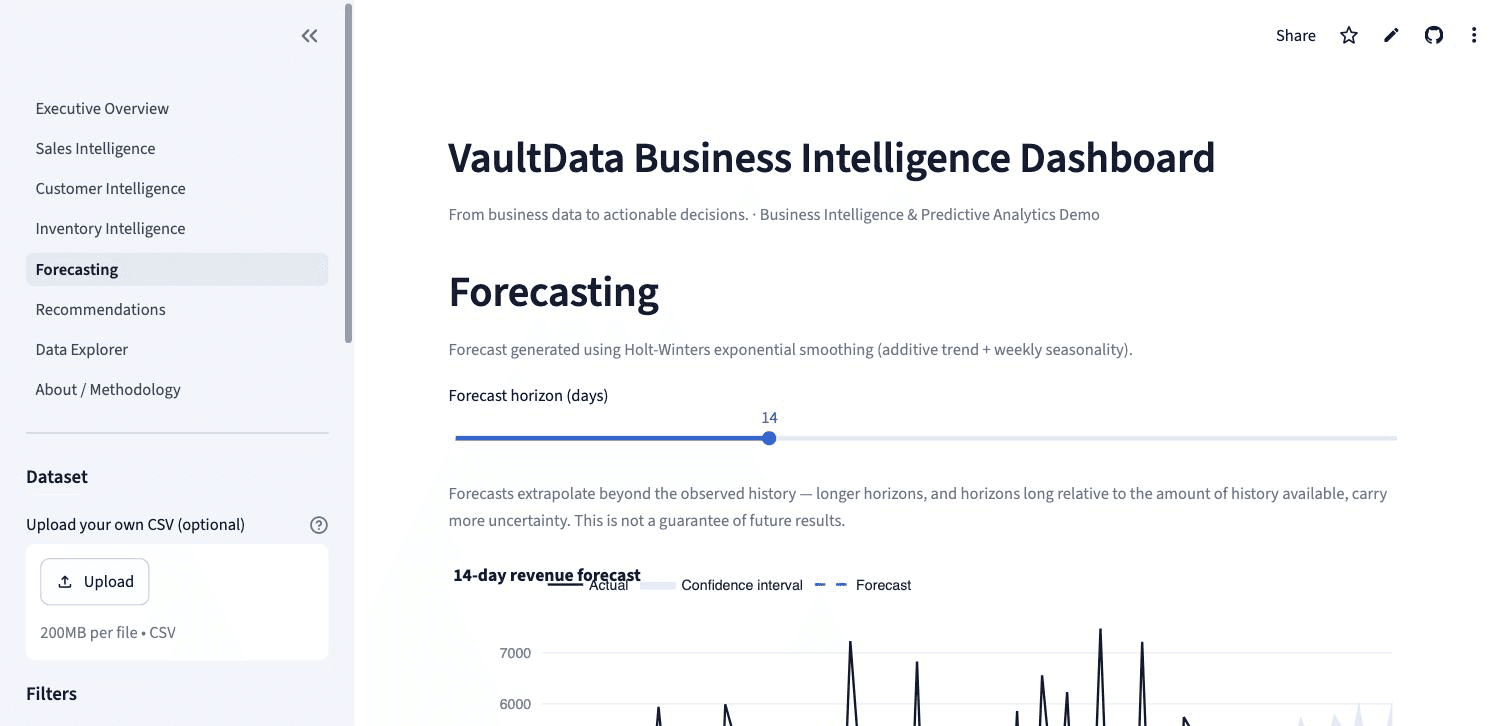
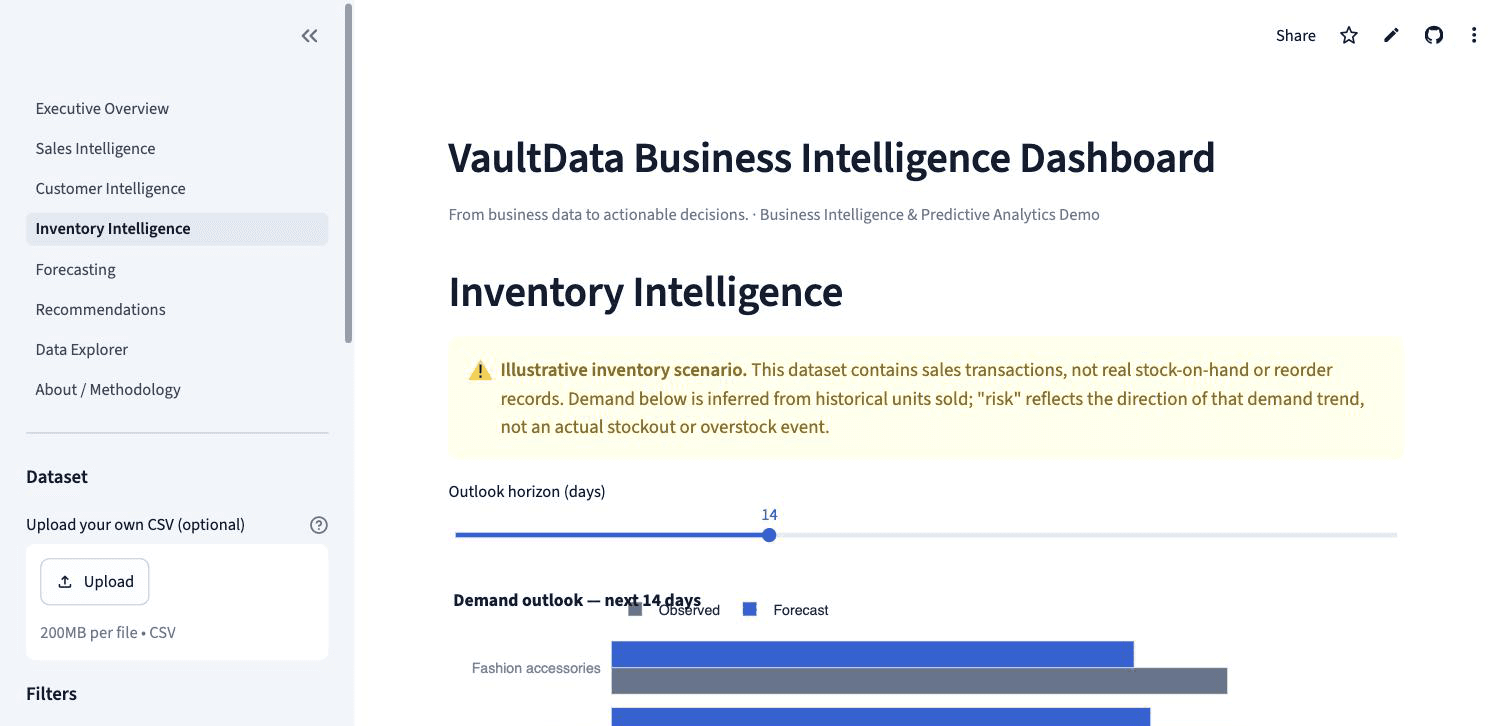
An interactive analytics solution demonstrating how businesses can transform operational data into actionable intelligence through visualization, customer segmentation, forecasting, and predictive analytics.
- Executive KPIs with period-over-period revenue growth
- Transaction-level customer segmentation (k-means, silhouette-validated)
- Holt-Winters revenue forecasting with a time-ordered holdout validation (MAE/RMSE/MAPE)
- Illustrative inventory demand outlook with stockout/overstock risk flags
- Automated data-quality checks and a recommendations engine driven by the live data
See it in action
Try a live VaultData dashboard
This is a simplified, interactive preview of the kind of dashboard we build — filter it below.
Total bookings
143
vs previous period
+4.2%
Not sure where to start?
We'll help you find the right entry point
Most engagements start with a short discovery call — we'll look at what data you already have and recommend the service that gets you the fastest win.
Start Your Data Project
Book a free 30-minute consultation and we'll map out where to start.